Process Mining + AI for Jira workflows
AI Process Optimizer for Jira
Reveal bottlenecks, rework loops, workflow variants and compliance risk from Jira history — then generate automation packs to fix the highest‑impact issues.
Process Mining
AI Findings
Automation Packs
Compliance

Real workflows
Variants, steps, loops, waits & handoffs
Actionable findings
Performance + compliance issues with evidence
Automation packs
A4J, ScriptRunner, JMWE, JWT
Measurable ROI
Reduce rework + cycle time + admin overhead
Visualize real Jira workflows
See how work actually flows across statuses and handoffs — including variants, wait states, and hidden loops.

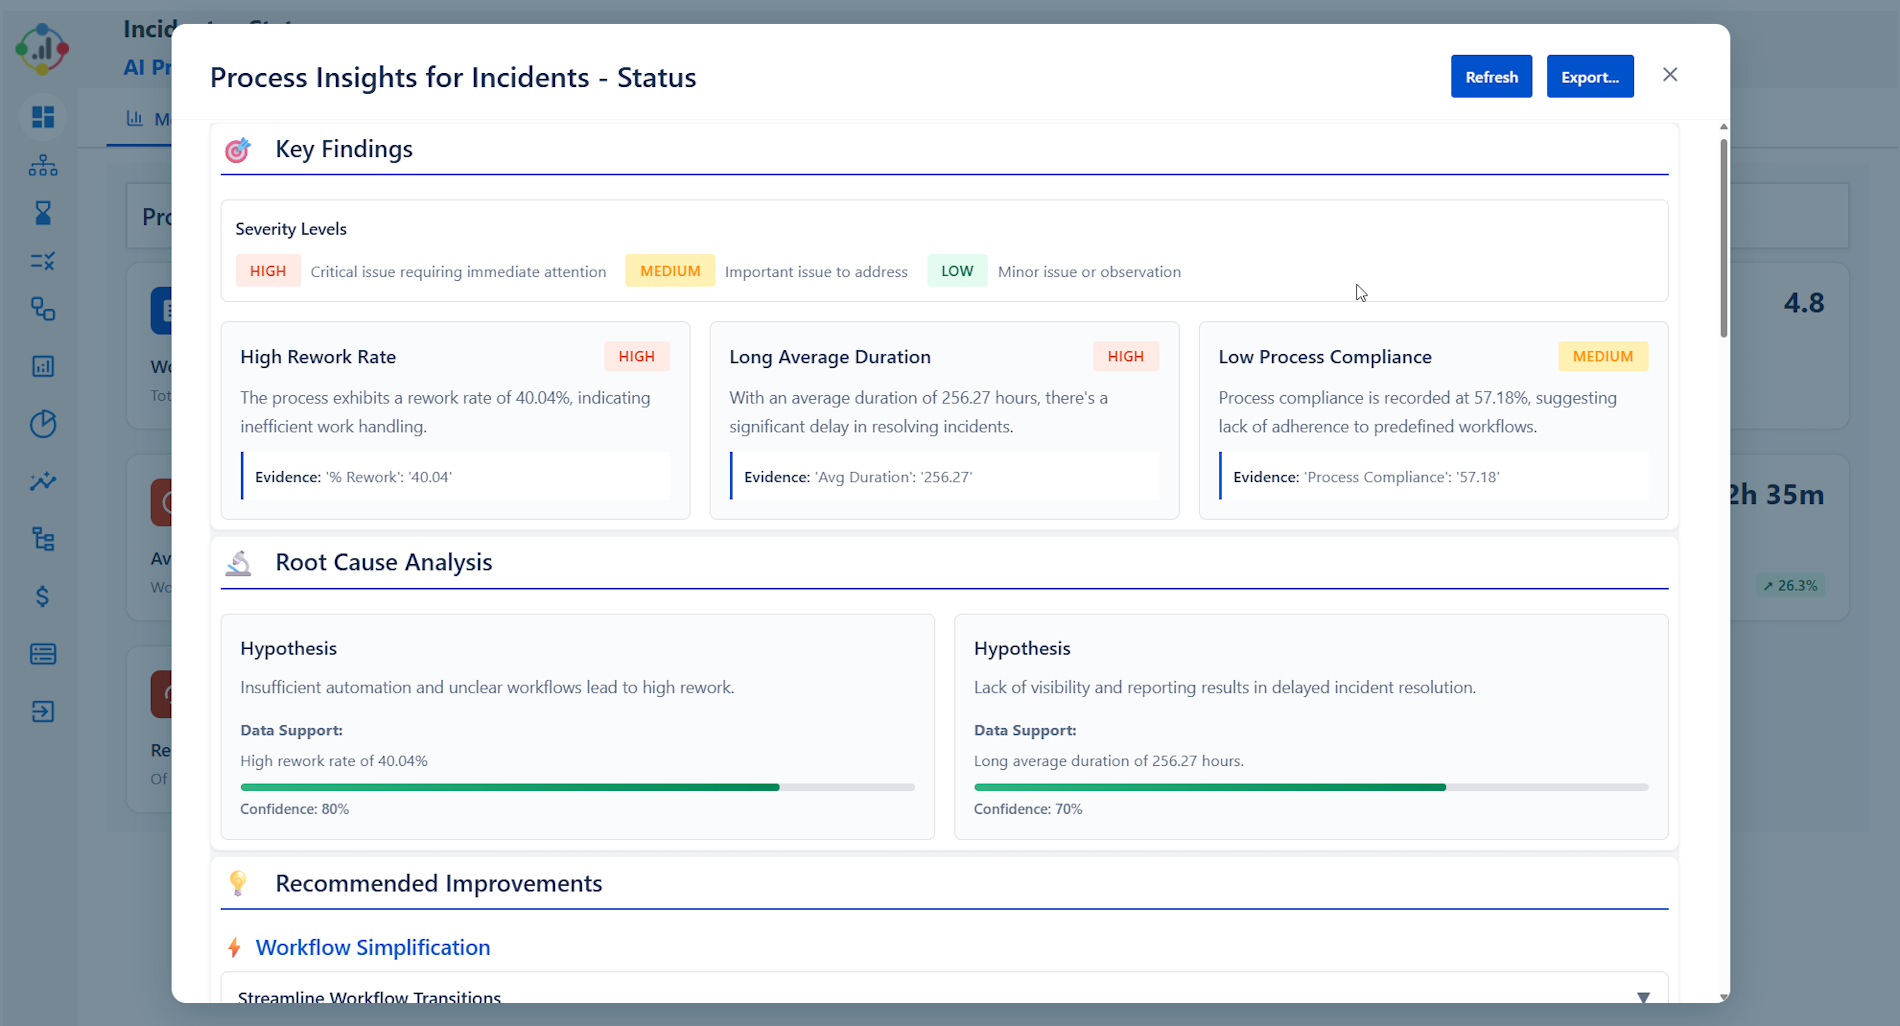
AI findings with cost‑saving insights
Apply best‑practice findings to detect performance issues, compliance gaps, and optimization opportunities with measurable impact.
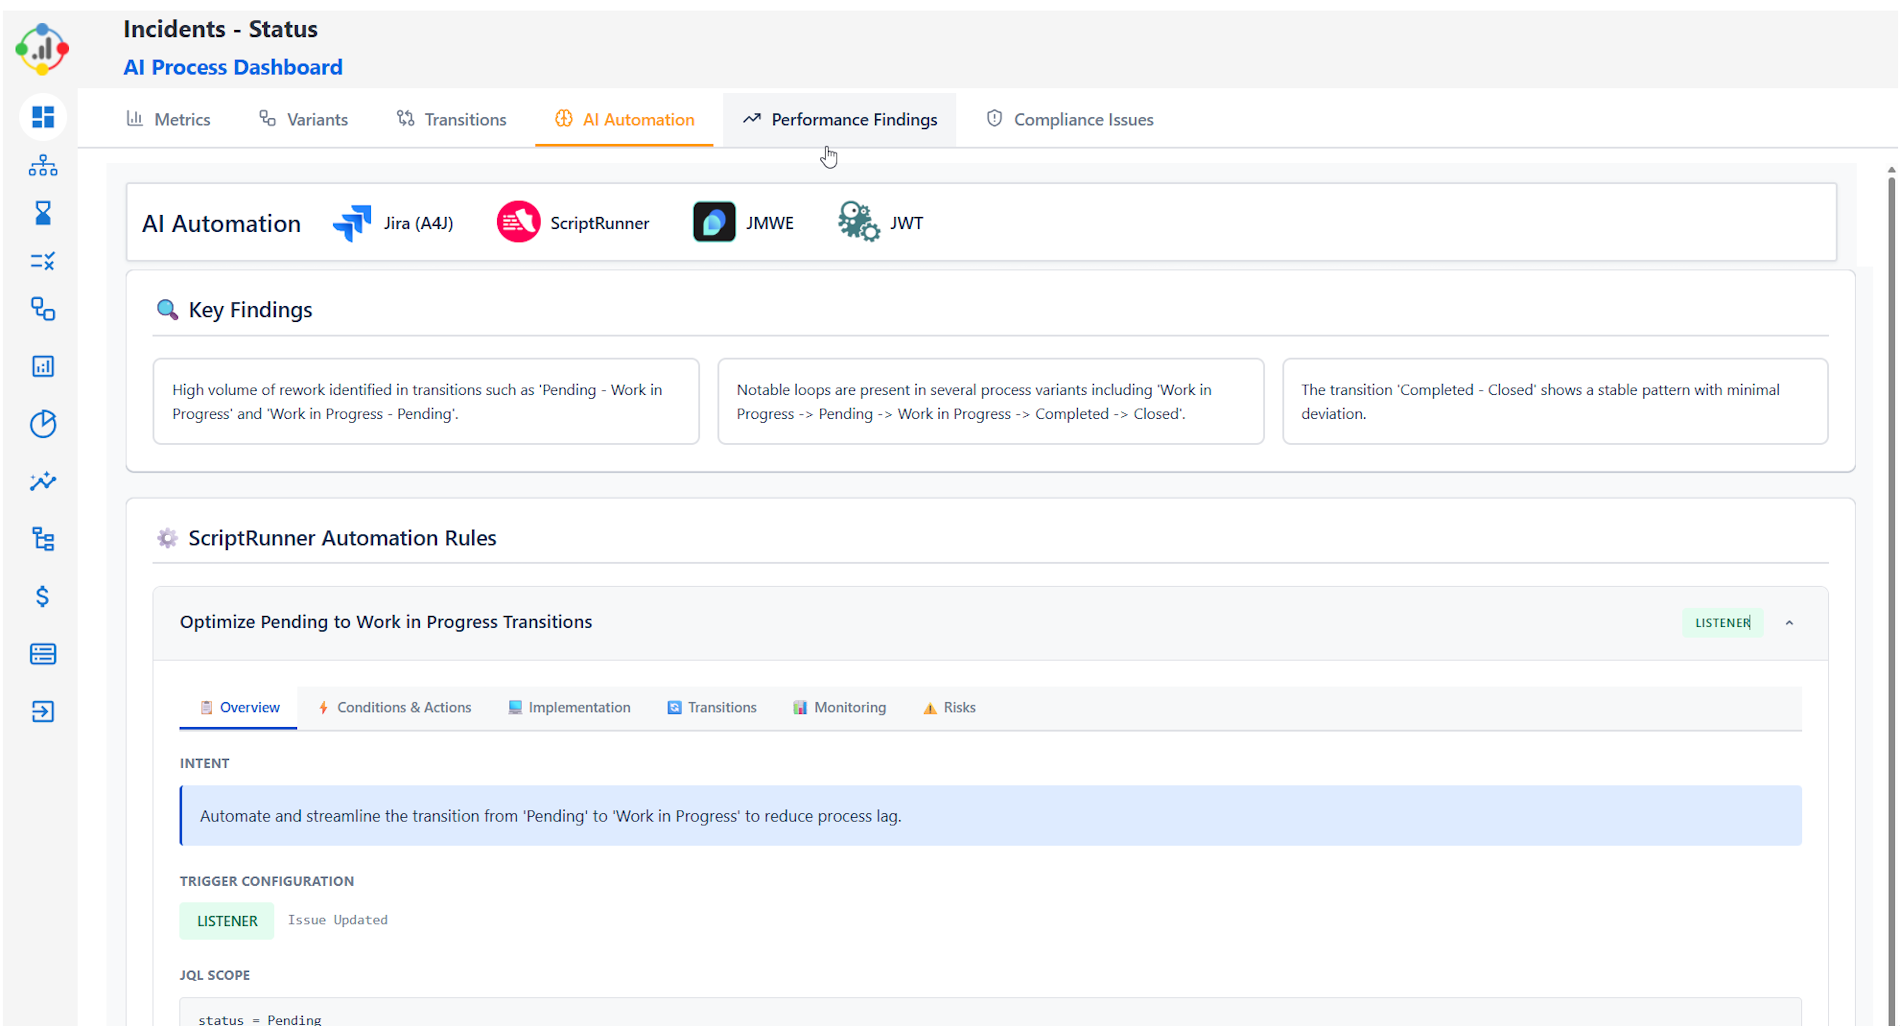
Generate automation packs instantly
Turn insights into action with ready‑to‑use packs for Automation for Jira, ScriptRunner, JMWE and JWT.
Next step
Want to see this on your Jira data?
Start with the Marketplace listing, or explore the demo site.